Car top and mobile OOH results: measured, sourced, dated
Measured mobile OOH results exist, but fewer than the industry implies. Below are figures with a publisher, a measurement partner and a date: a LoopMe brand-lift study on digital car tops, two Reveal reach studies, and independent OOH results from Nielsen, the OAAA and Uber Advertising. After them, three widely quoted numbers that fall apart when followed back.
What did a control-group study of digital car tops measure?
A cosmetics brand ran Firefly digital tops across Chicago, New York, Los Angeles and Miami, targeting high-value zip codes around Times Square, Michigan Avenue and the Walk of Fame. LoopMe surveyed audiences exposed to the campaign against a matched control. Firefly published the case study on 28 November 2024; the figures below link to it.
The campaign targeted 30,000,000 impressions and delivered 39,981,921, which the study reports as 33% added value. Read the lifts with that in mind: this is one campaign with a control group, not a category average, and the brand is unnamed in the published study.
- +85%
- Purchase intent
- +44%
- Brand recall
- 39.9M
- Impressions delivered
- 2.8x
- Unique reach growth
Exposed audience vs control
Same campaign, four markets
Against a 30M target, 33% added value
Moving OOH added to a stationary buy
The study types behind those figures, brand study, foot traffic, web and app conversion and retargeting, are the ones Firefly lists on its measurement and attribution page, each run with a named third-party partner. Ask any vendor for the same list, and for the control design behind each item on it.
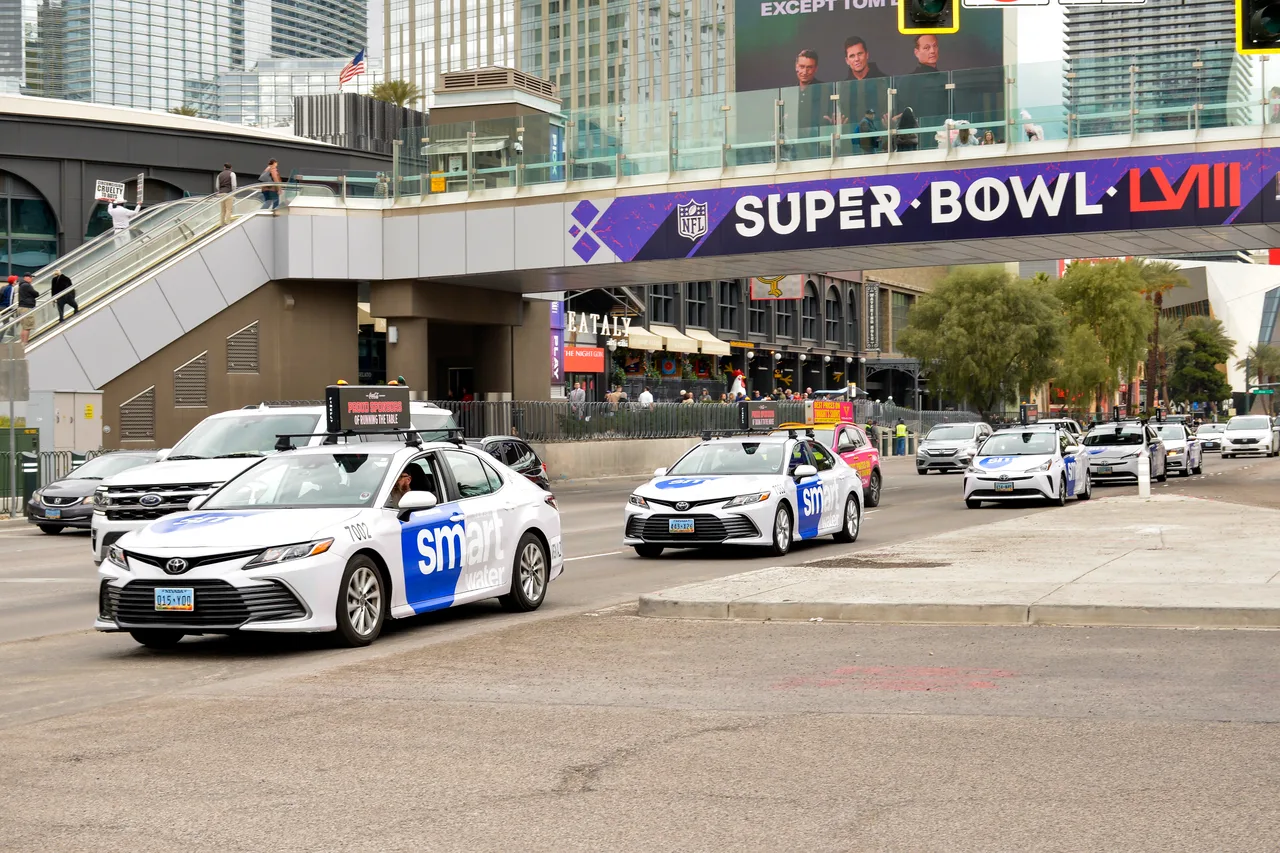
How much reach does moving OOH add to a stationary buy?
Firefly has published two studies run with the out-of-home measurement firm Reveal. The first, released on 1 October 2025, found that using stationary and moving OOH together lifted campaign performance by 50% to 100% against stationary alone. The second, The Amplifying Effect Part II, published on 6 May 2026, examined the reach and frequency mechanics behind that result across multiple campaigns in major US markets, using de-duplicated mobile location data to measure exposure at the individual level.
Its findings: moving OOH generated up to 2.8 times greater growth in unique reach relative to impression growth when added to stationary-only campaigns; digital car tops delivered 60% to 80% greater unique reach than stationary formats at equivalent impression levels; and frequency moved from concentrated exposure of 5 to 19 impressions toward an effective range of 3 to 8.
The mechanism is not complicated. A fixed board reaches the same commuters repeatedly. A fleet moving through a market keeps meeting people the board never passes, which converts wasted frequency into incremental reach.
What have independent OOH studies measured?
None of these four was produced by Firefly. They cover stationary OOH, in-app rideshare placements and industry-wide recall, so they bracket the vehicle formats rather than measure them directly, and each carries its date because the oldest is from 2019.
- 3.6x
- Unaided awareness, year on year
- 1 in 2
- Recall after 2.5 seconds of viewing
- 49%
- Adults noticing OOH more than a year earlier
- 90%
- US travelers who noticed OOH in the past month
Luxottica OOH campaigns in Los Angeles and New York, 2022 to 2023; +4.0% unaided awareness, +1.9% purchase intent, 1.31x cost efficiency
Ads in the Uber app; 6.6x the attentive seconds of online video, social feed and mobile display; brand consideration +27% on average
OAAA and Harris Poll finding cited alongside a Solomon Partners aggregation of 2017 to 2022 recall studies, in which OOH recall outranked TV, radio, print, podcasts and online
80% in the past week; 81% noticed a billboard, 55% a digital billboard. Pre-pandemic fieldwork, quoted here with its age
The Nielsen case is the closest analogue to a car top buy: localized OOH in two of the same markets, measured with a nationally representative survey and modelled to channel level. The Solomon Partners analysis is an aggregation of public recall studies from 2017 to 2022, not a single fieldwork, which is why it is quoted here as a ranking rather than a percentage.
Which mobile OOH statistics do not hold up?
These three appear on most vendor sites in this category, usually without a date. Here is what happens when you follow them back.
97% recall rate for mobile billboards
Vendor pages credit it to Outdoor Advertising Magazine, to the Transport Advertising Council, or to an Arbitron study, and some present it as an OAAA figure. None links a primary document, and the OAAA page that does discuss recall, the Solomon Partners aggregation above, makes no such claim. Until someone produces the study, the number is folklore.
40,000 to 70,000 daily impressions per vehicle
We could not find a published methodology behind the range: no market, no traffic dataset, no definition of an impression. The only impression number that counts is the one produced for your campaign, in your markets, from GPS logs matched to traffic counts. Ask any vendor quoting the range which market and which model it came from.
Sub-$0.10 CPM for car top advertising
A CPM built on gross opportunity-to-see and a CPM built on a modelled viewed impression can differ by more than an order of magnitude for the same campaign. Comparing two vendors quoting different methods tells you nothing. Compare the counting method first, then the price.
How should you read a results claim?
Four questions separate a measurement from a number. Every figure above was put through them before it went on the page.
- Who measured it?
- A named third party (LoopMe, Reveal, Nielsen, Lumen) or the operator itself. Operator-measured is not worthless, but it is a different grade of evidence.
- Against what?
- A matched control group, a prior period, or nothing. A lift figure with no control is a before-and-after, and a before-and-after with no date is an anecdote.
- When?
- A figure from 2019 is not wrong because it is old; it is wrong when it is presented as current. Every result on this page carries its publication date for that reason.
- What is the denominator?
- A percentage lift on brand favorability tells you nothing without the base rate and the sample. Ask for both, and ask whether the sample was national or in the campaign geography.
The formats page sets out how each vehicle format is counted in the first place, and the car top advertising guide covers what a proposal should put in writing before any of these numbers apply.
Frequently asked questions
Does car top advertising actually work?
In the one published control-group study on digital car tops, a cosmetics brand campaign across Chicago, New York, Los Angeles and Miami produced a 43% brand lift, a 44% lift in recall, a 46% lift in favorability and an 85% lift in purchase intent among exposed audiences against a matched control, measured by LoopMe, in a case study Firefly published on 28 November 2024. That is one campaign, not a category average; read it as evidence that the format can be measured, not as a promise.
How is mobile OOH reach measured?
With deduplicated mobile location data. The Firefly and Reveal white paper published on 6 May 2026 analysed multiple campaigns across major US markets using de-duplicated mobile advertising IDs to measure exposure, reach and frequency at the individual level, and found moving OOH grew unique reach up to 2.8 times faster than impressions when added to stationary-only plans. Impressions from GPS logs are the input; reach needs the device layer.
Is the 97% recall statistic for mobile billboards real?
We could not find the study. Vendor pages attribute the figure to three different sources and none links a document; it is also sometimes credited to the OAAA, whose published recall analysis with Solomon Partners (January 2023) contains no such number. Treat it as unverified until a primary source appears.
How many impressions does a car top ad get per day?
There is no honest generic answer. The 40,000 to 70,000 per day range that circulates has no published method behind it. The number for your campaign comes from GPS logs matched to traffic and pedestrian counts on the streets actually driven, and it changes by market, daypart and route. Ask for the method before the figure.
What is a good brand lift for an OOH campaign?
Published benchmarks vary too much by category and base rate to name one number. The two measured cases here give the range: Nielsen reported +4.0% unaided awareness and +1.9% purchase intent for Luxottica OOH in Los Angeles and New York (2022 to 2023), while the LoopMe study on digital car tops reported lifts of 43% to 85% on four metrics. Judge a proposal by whether it commits to a control-group study, not by the lift it predicts.
Are these results from Firefly campaigns?
Two of the studies are: the LoopMe brand-lift case and the Reveal reach studies were commissioned by Firefly, which also published them. The Nielsen, OAAA and Uber Advertising figures are independent of Firefly and are here so the page is not single-source. Every figure links to its publisher.
What to send us
- Market, or markets
- Dates, or flight length
- Budget band
- The metric you will judge it by
A person replies with a written range and the formats that fit. No rate card exists; every number on this site is a published third-party figure.
Send the briefThe archive this site draws on
- 603
- Brands documented
- 3,783
- Campaign photographs
- 21
- US markets
- 21
- Vehicle formats
Coca-Cola, Adobe, Stripe, Shopify, Target, YSL, FIFA and 596 more
Every frame a live campaign, not a render
New York, Chicago, LA, San Francisco, Las Vegas and 16 more
Digital tops, wraps, swarms, LED trucks, in-car, hologram
Sources
- Firefly, Case Study: Boosting Key Brand Metrics with Firefly Digital Taxi/Rideshare Tops, measured by LoopMe, published 2024-11-28
- Firefly and Reveal, The Amplifying Effect Part II, published 2026-05-06
- Reveal, The Amplifying Effect: How Moving Out-of-Home Media Inclusion Enhances Campaign Performance, 2025-10-01
- Nielsen, Analyzing Out of Home Impact (Luxottica case study), 2024
- OAAA, Out of Home Advertising Produces Highest Levels of Consumer Recall, Solomon Partners 2023 benchmark, 2023-01-04
- OAAA, New Study Finds More Than 90% of US Travelers Notice OOH Advertising (Nielsen), 2019-05-21
- Uber Advertising, Driving Attention, Delivering Results: 2025 Lumen Attention Study (read 2026-09-14)